
![]() Press release
Press release
181KB
Earth's global average surface temperature in 2020 tied with 2016 as the warmest year on record, according to an analysis by N
Continuing the planet's long-term warming trend, the year's globally averaged temperature was 1.84 degrees Fahrenheit (1.02 d baseline 1951-1980 mean, according to scientists at NASA's Goddard Institute for Space Studies (GISS) in New York. 2020 edg amount, within the margin of error of the analysis, making the years effectively tied for the warmest year on record.
"The last seven years have been the warmest seven years on record, typifying the ongoing and dramatic warming trend," said G "Whether one year is a record or not is not really that important – the important things are long-term trends. With these trends, a climate increases, we have to expect that records will continue to be broken."
A Warming, Changing World
Tracking global temperature trends provides a critical indicator of the impact of human activities – specifically, greenhouse gas e average temperature has risen more than 2 degrees Fahrenheit (1.2 degrees Celsius) since the late 19th century.
Rising temperatures are causing phenomena such as loss of sea ice and ice sheet mass, sea level rise, longer and more intens and animal habitats. Understanding such long-term climate trends is essential for the safety and quality of human life, allowing h environment in ways such as planting different crops, managing our water resources and preparing for extreme weather events.
Ranking the Records
A separate, independent analysis by the National Oceanic and Atmospheric Administration (NOAA) concluded that 2020 was th record, behind 2016. NOAA scientists use much of the same raw temperature data in their analysis, but have a different baselin methodology. Unlike #NASA, NOAA also does not infer temperatures in polar regions lacking observations, which accounts for m #NASA and NOAA records.
Like all scientific data, these temperature findings contain a small amount of uncertainty – in this case, mainly due to changes in temperature measurement methods over time. The GISS temperature analysis (GISTEMP) is accurate to within 0.1 degrees Fahrenheit with a 95 percent confidence level for the most recent period.
Beyond a Global, Annual Average
While the long-term trend of warming continues, a variety of events and factors contribute to any particular year's average tempe changed the amount of sunlight reaching the Earth's surface. The Australian bush fires during the first half of the year burned 46 releasing smoke and other particles more than 18 miles high in the atmosphere, blocking sunlight and likely cooling the atmosph shutdowns related to the ongoing coronavirus (COVID-19) pandemic reduced particulate air pollution in many areas, allowing mo and producing a small but potentially significant warming effect. These shutdowns also appear to have reduced the amount of ca year, but overall CO2 concentrations continued to increase, and since warming is related to cumulative emissions, the overall am minimal.
The largest source of year-to-year variability in global temperatures typically comes from the El Nino-Southern Oscillation (ENSO heat exchange between the ocean and atmosphere. While the year has ended in a negative (cool) phase of ENSO, it started in a which marginally increased the average overall temperature. The cooling influence from the negative phase is expected to have 2020.
"The previous record warm year, 2016, received a significant boost from a strong El Nino. The lack of a similar assist from El Nin background climate continues to warm due to greenhouse gases," Schmidt said.
The 2020 GISS values represent surface temperatures averaged over both the whole globe and the entire year. Local weather p variations, so not every region on Earth experiences similar amounts of warming even in a record year. According to NOAA, part experienced record high temperatures in 2020, while others did not.
In the long term, parts of the globe are also warming faster than others. Earth's warming trends are most pronounced in the Arcti shows is warming more than three times as fast as the rest of the globe over the past 30 years, according to Schmidt. The loss o minimum area is declining by about 13 percent per decade – makes the region less reflective, meaning more sunlight is absorbe rise further still. This phenomenon, known as Arctic amplification, is driving further sea ice loss, ice sheet melt and sea level rise, and permafrost melt.
Land, Sea, Air and Space
NASA's analysis incorporates surface temperature measurements from more than 26,000 weather stations and thousands of ship- and buoy-based observations of sea surface temperatures. These raw measurements are analyzed using an algorithm that considers the varied spacing of temperature stations around the globe and urban heating effects that could skew the conclusions if not taken into account. The result of these calculations is an estimate of the global average temperature difference from a baseline period of 1951 to 1980.
NASA measures Earth's vital signs from land, air, and space with a fleet of satellites, as well as airborne and ground-based obse surface temperature record from the Atmospheric Infrared Sounder (AIRS) instrument aboard NASA's Aura satellite confirms the seven years being the warmest on record. Satellite measurements of air temperature, sea surface temperature, and sea levels, a observations, also reflect a warming, changing world. The agency develops new ways to observe and study Earth's interconnect data records and computer analysis tools to better see how our planet is changing. #NASA shares this unique knowledge with the institutions in the United States and around the world that contribute to understanding and protecting our home planet.

0
![]() 480x360, 23KB
480x360, 23KB
![]() Press release
Press release
181KB
Related news |
||
|

|

|
february 28, 2024
|
february 13, 2024
|
january 12, 2024
|
|
NASA and Intuitive Machines will co-host a televised news conference at 2 p.m. EST Wednesday, Feb. 28, from the agency’s Johnson S... |
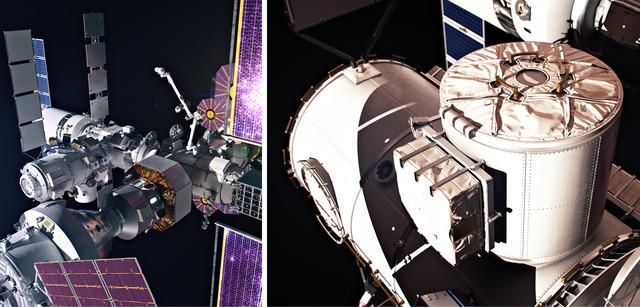
NASA will provide live coverage of the launch and docking of a Roscosmos cargo spacecraft carrying about three tons of food, fuel,... |
NASA will host a media teleconference at 12 p.m. EST, Wednesday, Jan. 17, to discuss the upcoming launch and science objectives of... |
You might be interested in |
||

|

|

|
january 08, 2024
|
september 25, 2023
|
august 18, 2023
|
|
NASA and the Mohammed Bin Rashid Space Centre (MBRSC) have entered into an agreement for MBRSC to provide the Crew and Science Air... |
NASA will host a media teleconference at 4 p.m. EDT on Tuesday, Sept. 26, to discuss the upcoming annular solar eclipse. The annul... |
Editor's Note: This release has been updated to add additional graphics, captions, and to spell out the words degrees Fahrenheit a... |
© Copyright 2024


 Italian
  Share
Share Share via mail
  Automotive
 Sport
Sport Events
 Art&Culture
 Design
 Fashion&Beauty
 Food&Hospitality
 Technology
 Nautica
 Racing
 Excellence
 Corporate
 OffBeat
 Green
Green Gift
Gift Pop
Pop Heritage
 Entertainment
 Health & Wellness