
gennaio 26, 2021 - 3m
3M - 3M Reports Fourth-Quarter and Full-Year 2020 Results; Provides Full-Year 2021 Guidance
Comunicato Stampa disponibile solo in lingua originale.
Fourth-Quarter Highlights:
- Sales of $8.6 billion, up 5.8 percent; organic local-currency sales increased 5.5 percent
- Both GAAP and adjusted EPS of $2.38
- Operating cash flow of $2.5 billion; adjusted free cash flow of $2.1 billion, up 16 percent
Full-Year Highlights:
- Sales of $32.2 billion, up 0.1 percent; organic local-currency sales declined 1.7 percent
- GAAP EPS of $9.25; adjusted EPS of $8.74
- Operating cash flow of $8.1 billion; adjusted free cash flow of $6.7 billion, up 18 percent
- Reduced both total debt by $1.5 billion, or 7 percent, and net debt by $4.1 billion, or 23 percent
- Returned $3.8 billion to shareholders via dividends and gross share repurchases
2021 Guidance:
- Sales growth in the range of 5 to 8 percent, organic local-currency growth of 3 to 6 percent
- Earnings per share of $9.20 to $9.70
ST. PAUL, Minn., Jan. 26, 2021 /PRNewswire/ -- #3m (NYSE: MMM) today reported fourth-quarter and full-year 2020 results and provided its 2021 financial outlook.
"The #3m team delivered a strong fourth quarter with organic growth across all business groups, robust cash flow and a double-digit increase in earnings per share," said Mike Roman, #3m chairman and chief executive officer. "In an uncertain economic environment, we stayed focused on innovating for our customers, improving our operational execution and fighting the pandemic from every angle."
"Throughout 2020 we distributed two billion respirators globally and supported the development and manufacturing of vaccines and therapeutics to help the world respond to COVID-19," Roman continued. "We also took significant actions to transform and build #3m for the future, while advancing our core values. Moving forward we will continue to prioritize investments in growth, productivity and sustainability as we build on our progress and deliver strong results in 2021."
Fourth-Quarter Results
3M delivered year-on-year growth across all business segments and geographic areas even as the COVID-19 pandemic continues to evolve and affect 3M's businesses in a number of ways. During the fourth quarter, end-market demand remained strong in personal safety, home improvement, general cleaning, semiconductor, data center and biopharma filtration. At the same time, several other end markets continued to experience year-on-year declines primarily driven by COVID-19-related headwinds, including healthcare and oral care elective procedures, consumer electronics, hospitality, office supplies, and healthcare IT.
Sales grew 5.8 percent year-on-year to $8.6 billion. Organic local-currency sales increased 5.5 percent while acquisitions, net of divestitures, decreased sales by 1.1 percent. Foreign currency translation increased sales by 1.4 percent year-on-year.
Total sales grew 12.7 percent in Safety and Industrial, 10.6 percent in Consumer, 5.4 percent in Health Care, and 2.3 percent in Transportation and Electronics. Organic local-currency sales increased 11.4 percent in Safety and Industrial, 9.9 percent in Consumer, 6.6 percent in Health Care, and 1.4 percent in Transportation and Electronics.
On a geographic basis, total sales grew 7.4 percent in EMEA (Europe, Middle East and Africa), 5.8 percent in the Americas, and 5.3 percent in Asia Pacific. Organic local-currency sales grew 7.9 percent in the Americas, 5.6 percent in EMEA, and 1.7 percent in Asia Pacific.
Both fourth-quarter GAAP and adjusted earnings were $2.38 per share, resulting in year-on-year increases of 43.4 percent and 22.1 percent on a GAAP-and adjusted-basis, respectively. Fourth quarter operating income was $1.8 billion with operating margins of 21.5 percent, as referenced in the "Supplemental Financial Information Non-GAAP Measures" section.
The company's operating cash flow was $2.5 billion with adjusted free cash flow of $2.1 billion contributing to adjusted free cash flow conversion of 151 percent. #3m paid $848 million in cash dividends to shareholders during the fourth quarter. The company reduced total debt by $0.8 billion, or down 4 percent, and net debt by $1.3 billion, or 9 percent, sequentially. See the "Supplemental Financial Information Non-GAAP Measures" section for applicable information.
Fourth-Quarter Business Group Discussion
Safety and Industrial
- Sales of $3.1 billion, up 12.7 percent in U.S. dollars. Organic local-currency sales increased 11.4 percent and foreign currency translation increased sales by 1.3 percent.
- On an organic local-currency basis:
- Sales increased in personal safety, roofing granules, industrial adhesives and tapes, and electrical markets; sales declined in automotive aftermarket, abrasives, and closure and masking.
- Sales grew in the Americas, EMEA, and Asia Pacific.
- Segment operating income was $869 million, an increase of 50 percent year-on-year; operating margins of 27.7 percent.
Transportation and Electronics
- Sales of $2.3 billion, up 2.3 percent in U.S. dollars. Organic local-currency sales increased 1.4 percent, foreign currency translation increased sales by 2.2 percent, and divestitures decreased sales by 1.3 percent.
- On an organic local-currency basis:
- Sales increased in automotive and aerospace, transportation safety, electronics, and advanced materials; sales declined in commercial solutions.
- Sales grew in Asia Pacific; sales were flat in EMEA; sales declined in the Americas.
- Segment operating income was $511 million, an increase of 8 percent year-on-year; operating margins of 21.8 percent.
Health Care
- Sales of $2.3 billion, up 5.4 percent in U.S. dollars. Organic local-currency sales increased 6.6 percent, foreign currency translation increased sales by 1.6 percent and acquisitions, net of divestitures, decreased sales by 2.8 percent.
- On an organic local-currency basis:
- Sales increased in medical solutions, separation and purification, and food safety; sales declined in oral care and health information systems.
- Sales grew in the Americas, EMEA; sales were flat in Asia Pacific.
- Segment operating income was $558 million, an increase of 22 percent year-on-year; operating margins were 24.7 percent.
Consumer
- Sales of $1.4 billion, up 10.6 percent in U.S. dollars. Organic local-currency sales increased 9.9 percent and foreign currency translation increased sales by 0.7 percent.
- On an organic local-currency basis:
- Sales increased in home improvement, home care, and consumer health care; sales declined in stationery and office supplies.
- Sales grew in the Americas and EMEA; sales declined in Asia Pacific.
- Segment operating income was $335 million, up 11 percent year-on-year; operating margins were 23.5 percent.
2020 Overview: Helping the world recover, building a better company, and positioning for growth
When the world needed #3m in 2020, we were there: fighting the pandemic from all angles, making and delivering more personal protective equipment than ever before, helping speed development of vaccines and therapeutics, and providing our expertise to governments around the world to manage pandemic response.
In addition, #3m forged partnerships with the U.S., Canada, Germany, and Singapore governments to create additional respirator manufacturing capacity. #3m applied its expertise to ensure business continuity and maintain strong customer service as market demand and government mandates rapidly shifted the flow of global supplies.
While stepping up its efforts to support pandemic care and recovery, #3m continued to deliver for customers: providing innovative solutions across our industry-leading businesses to improve health care, transportation and electronics, safety and industrial, and consumer products. At the same time, the company enhanced its financial flexibility with strong cash flow generation, aggressive cost reductions, and adjusted capital allocation plans.
The company's investments focused on building a better #3m that will be more efficient, effective, and connected to customers. As end markets have changed, #3m is well positioned take advantage of attractive global trends in personal safety, home improvement, e-commerce, automotive, and healthcare.
Stepping up our leadership in ESG
3M is expanding its commitments to improving the communities that it operates in and serves. In 2021, as part of the company's ongoing environmental stewardship, and as part of its 2021 capital expenditure plan, #3m expects to invest $100 million to further reduce water usage and improve water quality around its manufacturing locations.
Last year also marked a step forward for 3M's efforts to advance diversity, equity, and inclusion – the company introduced platforms for change to address racial opportunity gaps, empowering an inclusive culture, and supporting our communities with a plan to invest $50 million to advance workforce development and STEM education initiatives. In February, the company plans to publish its first Diversity, Equity and Inclusion report and outline its commitment to improving representation of minorities at the company.
Full-Year 2020 Results
Throughout 2020 the COVID-19 pandemic impacted 3M's end markets and business operations. During the year the company saw strong end-market demand in personal safety, home improvement, general cleaning, semiconductor, data center and biopharma filtration. At the same time, other end markets experienced year-on-year declines primarily driven by COVID-19-related headwinds, including healthcare and oral care elective procedures, industrial, consumer electronics, hospitality, office supplies, and healthcare IT.
Full-year 2020 sales grew 0.1 percent year-on-year to $32.2 billion. Organic local-currency sales decreased 1.7 percent while acquisitions, net of divestitures, increased sales by 2.1 percent. Foreign currency translation decreased sales by 0.3 percent year-on-year.
GAAP earnings were $9.25 per share, an increase of 18.4 percent. Excluding special items, adjusted earnings were $8.74 per share, a decrease of 1.5 percent. Full-year operating income was $7.2 billion with operating margins of 22.3 percent. Excluding special items, adjusted operating income and margins were $6.8 billion and 21.3 percent, respectively, as referenced in the "Supplemental Financial Information Non-GAAP Measures" section.
The company's operating cash flow was $8.1 billion with adjusted free cash flow of $6.7 billion, contributing to adjusted free cash flow conversion of 132 percent for the year. In addition, #3m generated 18.2 percent return on invested capital. Refer to the "Supplemental Financial Information Non-GAAP Measures" section.
For the full year, #3m paid $3.4 billion in cash dividends to shareholders and repurchased $368 million of its own shares.
Full-Year 2021 Outlook
3M initiated its full-year 2021 guidance with earnings expected to be in the range of $9.20 to $9.70 per share. The company expects its full-year total sales growth in the range of 5 to 8 percent with organic local-currency growth between 3 to 6 percent. #3m also expects its full-year free cash flow conversion to be in the range of 95 to 105 percent, as referenced in the "Supplemental Financial Information Non-GAAP Measures" section.
3M will conduct an investor teleconference at 9:00 a.m. EST (8:00 a.m. CST) today. Investors can access this conference via the following:
- Live webcast at http://investors.3M.com.
- Live telephone:
Call 800-762-2596 within the U.S. or +1 212-231-2916 outside the U.S. Please join the call at least 10 minutes before the start time. - Webcast replay:
Go to 3M's Investor Relations website at http://investors.3M.com and click on "Quarterly Earnings." - Telephone replay:
Call 800-633-8284 within the U.S. or +1 402-977-9140 outside the U.S. (for both U.S. and outside the U.S., the access code is 21972034). The telephone replay will be available until 11:30 a.m. EST (10:30 a.m. CST) on Feb. 2, 2021.
Forward-Looking Statements
This news release contains forward-looking information about 3M's financial results and estimates and business prospects that involve substantial risks and uncertainties. You can identify these statements by the use of words such as "anticipate," "estimate," "expect," "aim," "project," "intend," "plan," "believe," "will," "should," "could," "target," "forecast" and other words and terms of similar meaning in connection with any discussion of future operating or financial performance or business plans or prospects. Among the factors that could cause actual results to differ materially are the following: (1) worldwide economic, political, regulatory, capital markets and other external conditions and other factors beyond the Company's control, including natural and other disasters or climate change affecting the operations of the Company or its customers and suppliers; (2) risks related to public health crises such as the global pandemic associated with the coronavirus (COVID-19); (3) liabilities related to certain fluorochemicals, including lawsuits concerning various PFAS-related products and chemistries, and claims and governmental regulatory proceedings and inquiries related to PFAS in a variety of jurisdictions; (4) legal proceedings, including significant developments that could occur in the legal and regulatory proceedings described in the Company's Annual Report on Form 10-K for the year ended Dec. 31, 2019, and any subsequent quarterly reports on Form 10-Q (the "Reports"); (5) competitive conditions and customer preferences; (6) foreign currency exchange rates and fluctuations in those rates; (7) the timing and market acceptance of new product offerings; (8) the availability and cost of purchased components, compounds, raw materials and energy (including oil and natural gas and their derivatives) due to shortages, increased demand or supply interruptions (including those caused by natural and other disasters and other events); (9) unanticipated problems or delays with the phased implementation of a global enterprise resource planning (ERP) system, or security breaches and other disruptions to the Company's information technology infrastructure; (10) the impact of acquisitions, strategic alliances, divestitures and other unusual events resulting from portfolio management actions and other evolving business strategies, and possible organizational restructuring; (11) operational execution, including scenarios where the Company generates fewer productivity improvements than estimated; (12) financial market risks that may affect the Company's funding obligations under defined benefit pension and postretirement plans; and (13) the Company's credit ratings and its cost of capital. Changes in such assumptions or factors could produce significantly different results. A further description of these factors is located in the Reports under "Cautionary Note Concerning Factors That May Affect Future Results" and "Risk Factors" in Part I, Items 1 and 1A (Annual Report) and in Part I, Item 2 and Part II, Item 1A (Quarterly Reports), as updated by applicable Current Reports on Form 8-K. The information contained in this news release is as of the date indicated. The Company assumes no obligation to update any forward-looking statements contained in this news release as a result of new information or future events or developments.
3M Company and Subsidiaries | |||||||||||||
CONSOLIDATED STATEMENT OF INCOME | |||||||||||||
(Millions, except per-share amounts) | |||||||||||||
(Unaudited) | |||||||||||||
Three months ended | Year ended | ||||||||||||
December 31, | December 31, | ||||||||||||
2020 | 2019 | 2020 | 2019 | ||||||||||
Net sales | $ | 8,583 | $ | 8,111 | $ | 32,184 | $ | 32,136 | |||||
Operating expenses | |||||||||||||
Cost of sales | 4,388 | 4,325 | 16,605 | 17,136 | |||||||||
Selling, general and administrative expenses | 1,890 | 1,940 | 6,929 | 7,029 | |||||||||
Research, development and related expenses | 456 | 521 | 1,878 | 1,911 | |||||||||
Gain on sale of businesses | — | — | (389) | (114) | |||||||||
Total operating expenses | 6,734 | 6,786 | 25,023 | 25,962 | |||||||||
Operating income | 1,849 | 1,325 | 7,161 | 6,174 | |||||||||
Other expense (income), net | 139 | 113 | 450 | 462 | |||||||||
Income before income taxes | 1,710 | 1,212 | 6,711 | 5,712 | |||||||||
Provision for income taxes | 316 | 242 | 1,318 | 1,130 | |||||||||
Income of consolidated group | 1,394 | 970 | 5,393 | 4,582 | |||||||||
Income (loss) from unconsolidated subsidiaries, net of taxes | (4) | — | (5) | — | |||||||||
Net income including noncontrolling interest | 1,390 | 970 | 5,388 | 4,582 | |||||||||
Less: Net income (loss) attributable to noncontrolling interest | 1 | 1 | 4 | 12 | |||||||||
Net income attributable to 3M | $ | 1,389 | $ | 969 | $ | 5,384 | $ | 4,570 | |||||
Weighted average #3m common shares outstanding – basic | 578.7 | 576.3 | 577.6 | 577.0 | |||||||||
Earnings per share attributable to #3m common shareholders – basic | $ | 2.40 | $ | 1.68 | $ | 9.32 | $ | 7.92 | |||||
Weighted average #3m common shares outstanding – diluted | 584.0 | 582.7 | 582.2 | 585.1 | |||||||||
Earnings per share attributable to #3m common shareholders – diluted | $ | 2.38 | $ | 1.66 | $ | 9.25 | $ | 7.81 | |||||
3M Company and Subsidiaries | |||||||
CONDENSED CONSOLIDATED BALANCE SHEET | |||||||
(Dollars in millions) | |||||||
(Unaudited) | |||||||
December 31, | December 31, | ||||||
2020 | 2019 | ||||||
ASSETS | |||||||
Current assets | |||||||
Cash and cash equivalents | $ | 4,634 | $ | 2,353 | |||
Marketable securities – current | 404 | 98 | |||||
Accounts receivable – net | 4,705 | 4,791 | |||||
Inventories | 4,239 | 4,134 | |||||
Prepaids | 675 | 704 | |||||
Other current assets | 325 | 891 | |||||
Total current assets | 14,982 | 12,971 | |||||
Property, plant and equipment – net | 9,421 | 9,333 | |||||
Operating lease right of use assets | 864 | 858 | |||||
Goodwill and intangible assets – net | 19,637 | 19,823 | |||||
Other assets | 2,440 | 1,674 | |||||
Total assets | $ | 47,344 | $ | 44,659 | |||
LIABILITIES AND EQUITY | |||||||
Current liabilities | |||||||
Short-term borrowings and | |||||||
current portion of long-term debt | $ | 806 | $ | 2,795 | |||
Accounts payable | 2,561 | 2,228 | |||||
Accrued payroll | 747 | 702 | |||||
Accrued income taxes | 300 | 194 | |||||
Operating lease liabilities – current | 256 | 247 | |||||
Other current liabilities | 3,278 | 3,056 | |||||
Total current liabilities | 7,948 | 9,222 | |||||
Long-term debt | 17,989 | 17,518 | |||||
Other liabilities | 8,476 | 7,793 | |||||
Total liabilities | $ | 34,413 | $ | 34,533 | |||
Total equity | $ | 12,931 | $ | 10,126 | |||
Shares outstanding | |||||||
December 31, 2020: 577,749,638 shares | |||||||
December 31, 2019: 575,184,835 shares | |||||||
Total liabilities and equity | $ | 47,344 | $ | 44,659 | |||
3M Company and Subsidiaries | |||||||
CONDENSED CONSOLIDATED STATEMENT OF CASH FLOWS | |||||||
(Dollars in millions) | |||||||
(Unaudited) | |||||||
Year ended | |||||||
December 31, | |||||||
2020 | 2019 | ||||||
NET CASH PROVIDED BY (USED IN) OPERATING ACTIVITIES | $ | 8,113 | $ | 7,070 | |||
Cash flows from investing activities: | |||||||
Purchases of property, plant and equipment | (1,501) | (1,699) | |||||
Acquisitions, net of cash acquired | (25) | (4,984) | |||||
Purchases and proceeds from sale or maturities of marketable securities and investments – net | 232 | (192) | |||||
Proceeds from sale of businesses, net of cash sold | 576 | 236 | |||||
Other investing activities | 138 | 195 | |||||
NET CASH PROVIDED BY (USED IN) INVESTING ACTIVITIES | (580) | (6,444) | |||||
Cash flows from financing activities: | |||||||
Change in debt | (1,875) | 3,249 | |||||
Purchases of treasury stock | (368) | (1,407) | |||||
Proceeds from issuances of treasury stock pursuant to stock option and benefit plans | 429 | 547 | |||||
Dividends paid to shareholders | (3,388) | (3,316) | |||||
Other financing activities | (98) | (197) | |||||
NET CASH PROVIDED BY (USED IN) FINANCING ACTIVITIES | (5,300) | (1,124) | |||||
Effect of exchange rate changes on cash and cash equivalents | 48 | (2) | |||||
Net increase (decrease) in cash and cash equivalents | 2,281 | (500) | |||||
Cash and cash equivalents at beginning of year | 2,353 | 2,853 | |||||
Cash and cash equivalents at end of period | $ | 4,634 | $ | 2,353 | |||
3M Company and Subsidiaries | ||||||||||||||||||||||
SUPPLEMENTAL FINANCIAL INFORMATION | ||||||||||||||||||||||
NON-GAAP MEASURES | ||||||||||||||||||||||
(Unaudited) | ||||||||||||||||||||||
(Dollars in millions, except per share amounts) | Operating Income | Operating Income Margin | Income Before Taxes | Provision for Income Taxes | Effective Tax Rate | Net Income Attributable to 3M | Earnings Per Diluted Share | Earnings per diluted share percent change | ||||||||||||||
Q4 2019 GAAP | $ | 1,325 | 16.3 | % | $ | 1,212 | $ | 242 | 19.9 | % | $ | 969 | $ | 1.66 | ||||||||
Adjustments for special items: | ||||||||||||||||||||||
Significant litigation-related charges/benefits | 214 | 214 | 48 | 166 | 0.29 | |||||||||||||||||
Q4 2019 adjusted amounts (non-GAAP measures) (a) | $ | 1,539 | 19.0 | % | $ | 1,426 | $ | 290 | 20.3 | % | $ | 1,135 | $ | 1.95 | ||||||||
Q4 2020 GAAP | $ | 1,849 | 21.5 | % | $ | 1,710 | $ | 316 | 18.5 | % | $ | 1,389 | $ | 2.38 | 43.4 | % | ||||||
Adjustments for special items: | ||||||||||||||||||||||
None | ||||||||||||||||||||||
Q4 2020 adjusted amounts (non-GAAP measures) (a) | $ | 1,849 | 21.5 | % | $ | 1,710 | $ | 316 | 18.5 | % | $ | 1,389 | $ | 2.38 | 22.1 | % | ||||||
(Dollars in millions, except per share amounts) | Operating Income | Operating Income Margin | Income Before Taxes | Provision for Income Taxes | Effective Tax Rate | Net Income Attributable to 3M | Earnings Per Diluted Share | Earnings per diluted share percent change | ||||||||||||||
Full Year 2019 GAAP | $ | 6,174 | 19.2 | % | $ | 5,712 | $ | 1,130 | 19.8 | % | $ | 4,570 | $ | 7.81 | ||||||||
Adjustments for special items: | ||||||||||||||||||||||
Significant litigation-related charges/benefits | 762 | 762 | 172 | 590 | 1.01 | |||||||||||||||||
Loss on deconsolidation of Venezuelan subsidiary | — | 162 | — | 162 | 0.28 | |||||||||||||||||
(Gain)/loss on sale of businesses | (114) | (114) | 15 | (129) | (0.22) | |||||||||||||||||
Full Year 2019 adjusted amounts (non-GAAP measures) (a) | $ | 6,822 | 21.2 | % | $ | 6,522 | $ | 1,317 | 20.2 | % | $ | 5,193 | $ | 8.88 | ||||||||
Full Year 2020 GAAP | $ | 7,161 | 22.3 | % | $ | 6,711 | $ | 1,318 | 19.6 | % | $ | 5,384 | $ | 9.25 | 18.4 | % | ||||||
Adjustments for special items: | ||||||||||||||||||||||
Significant litigation-related charges/benefits | 17 | 17 | 56 | (39) | (0.07) | |||||||||||||||||
(Gain)/loss on sale of businesses | (389) | (389) | (86) | (303) | (0.52) | |||||||||||||||||
Divestiture-related restructuring actions | 55 | 55 | 9 | 46 | 0.08 | |||||||||||||||||
Full Year 2020 adjusted amounts (non-GAAP measures) (a) | $ | 6,844 | 21.3 | % | $ | 6,394 | $ | 1,297 | 20.3 | % | $ | 5,088 | $ | 8.74 | (1.5) | % | ||||||
(a) | In addition to reporting financial results in accordance with U.S. GAAP, the Company also provides non-GAAP measures that adjust for the impact of special items. Special items for the periods presented include the items described in the section entitled "Description of Special Items". Beginning in 2020, the Company includes gain/loss on sale of businesses and divestiture-related restructuring actions as special items due to their potential distortion of underlying operating results. Information provided herein reflects the impact of this change for all periods presented. Operating income, income before taxes, net income, earnings per share, and effective tax rate are all measures for which #3m provides the reported GAAP measure and a measure adjusted for special items. The adjusted measures are not in accordance with, nor are they a substitute for, GAAP measures. The Company considers these non-GAAP measures in evaluating and managing the Company's operations. The Company believes that discussion of results adjusted for these items is meaningful to investors as it provides a useful analysis of ongoing underlying operating trends. The determination of these items may not be comparable to similarly titled measures used by other companies. |
3M Company and Subsidiaries | |||||||||||||
SUPPLEMENTAL FINANCIAL INFORMATION | |||||||||||||
NON-GAAP MEASURES – (CONTINUED) | |||||||||||||
(Unaudited) | |||||||||||||
Three months ended | Year ended | ||||||||||||
December 31, | December 31, | ||||||||||||
Major GAAP Cash Flow Categories (dollars in millions) | 2020 | 2019 | 2020 | 2019 | |||||||||
Net cash provided by (used in) operating activities | $ | 2,515 | $ | 2,338 | $ | 8,113 | $ | 7,070 | |||||
Net cash provided by (used in) investing activities | (259) | (5,299) | (580) | (6,444) | |||||||||
Net cash provided by (used in) financing activities | (1,802) | (2,451) | (5,300) | (1,124) | |||||||||
Free Cash Flow (non-GAAP measure) (dollars in billions) | Full-Year 2021 Forecast | ||||||||||||
Net cash provided by (used in) operating activities | $7.1 to $7.8 | ||||||||||||
Purchases of property, plant and equipment | ($1.8 to $2.0) | ||||||||||||
Free cash flow (b) | $5.1 to $6.0 | ||||||||||||
Net income attributable to 3M | $5.4 to $5.7 | ||||||||||||
Free cash flow conversion (b) | 95% to 105% | ||||||||||||
Three months ended | Year ended | ||||||||||||
December 31, | December 31, | ||||||||||||
Adjusted Free Cash Flow (non-GAAP measure) (dollars in millions) | 2020 | 2019 | 2020 | 2019 | |||||||||
Net cash provided by (used in) operating activities | $ | 2,515 | $ | 2,338 | $ | 8,113 | $ | 7,070 | |||||
Purchases of property, plant and equipment | (422) | (538) | (1,501) | (1,699) | |||||||||
Free cash flow | $ | 2,093 | $ | 1,800 | $ | 6,612 | $ | 5,371 | |||||
Adjustments for special items: | |||||||||||||
Significant litigation-related after-tax payment impacts | $ | 5 | $ | 7 | $ | 79 | $ | 267 | |||||
TCJA transition tax payments | — | — | 33 | — | |||||||||
Divestiture-related restructuring after-tax payment impacts | 6 | 6 | 12 | 60 | |||||||||
Adjusted free cash flow (c) | $ | 2,104 | $ | 1,813 | $ | 6,736 | $ | 5,698 | |||||
Net income attributable to 3M | $ | 1,389 | $ | 969 | $ | 5,384 | $ | 4,570 | |||||
Adjustments for special items: | |||||||||||||
Significant litigation-related charges/benefits | — | 166 | (39) | 590 | |||||||||
Loss on deconsolidation of Venezuelan subsidiary | — | — | — | 162 | |||||||||
(Gain)/loss on sale of businesses | — | — | (303) | (129) | |||||||||
Divestiture-related restructuring actions | — | — | 46 | — | |||||||||
Adjusted net income attributable to 3M (a) | $ | 1,389 | $ | 1,135 | $ | 5,088 | $ | 5,193 | |||||
Adjusted free cash flow conversion (c) | |||||||||||||
News correlate |
||
|

|

|
luglio 11, 2023
|
agosto 04, 2022
|
luglio 08, 2022
|
|
Comunicato Stampa disponibile solo in lingua originale. The company joins Adobe, Spotify, Nvidia, Morgan Stanley, and many others ... |
Comunicato Stampa disponibile solo in lingua originale. ST. PAUL, Minn., Aug. 4, 2022 /PRNewswire/ -- 3M Health Care's Medical Sol... |
Comunicato Stampa disponibile solo in lingua originale. ST.PAUL, Minn. and SILVER SPRING, Md., July 7, 2022/PRNewswire/ -- Today's... |


Ti potrebbe interessare anche |
||
|

|

|
aprile 29, 2022
|
aprile 27, 2022
|
aprile 21, 2022
|
|
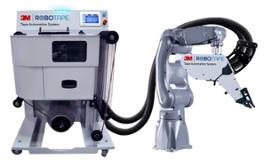
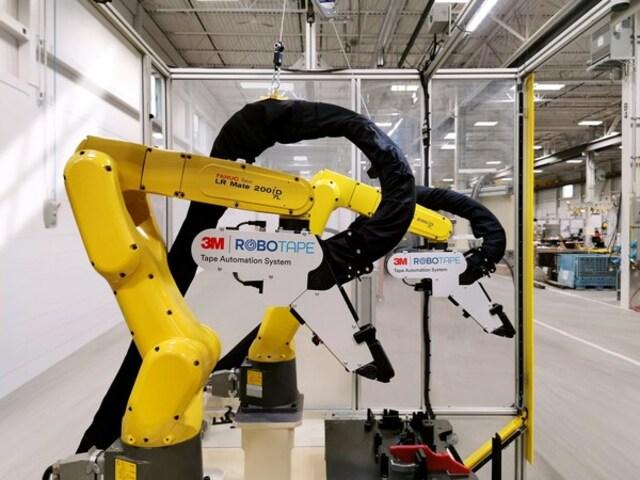
Comunicato Stampa disponibile solo in lingua originale. Solution automates tape applications to improve quality, enhance productiv... |
Comunicato Stampa disponibile solo in lingua originale. St. PAUL, Minn., April 27, 2022/PRNewswire/ -- 3MFood Safety was named a 2... |
Comunicato Stampa disponibile solo in lingua originale. Proven to protect, this innovative wrap expands by up to 60 times its orig... |


 Inglese
  Condividi
 Condividi via mail
  Automotive
 Sport
Sport Events
 Art&Culture
 Design
 Fashion&Beauty
 Food&Hospitality
 Tecnologia
 Nautica
 Racing
 Excellence
 Corporate
 OffBeat
 Green
Green Gift
Gift Pop
Pop Heritage
 Entertainment
 Health & Wellness